
How much does changing taps change the bill?
At the middle venue in this sample, the dearest listed pint costs $2.00 more than the cheapest. That is a choice within one pub, before you compare pubs.
median cheapest-to-dearest regular-pint gap
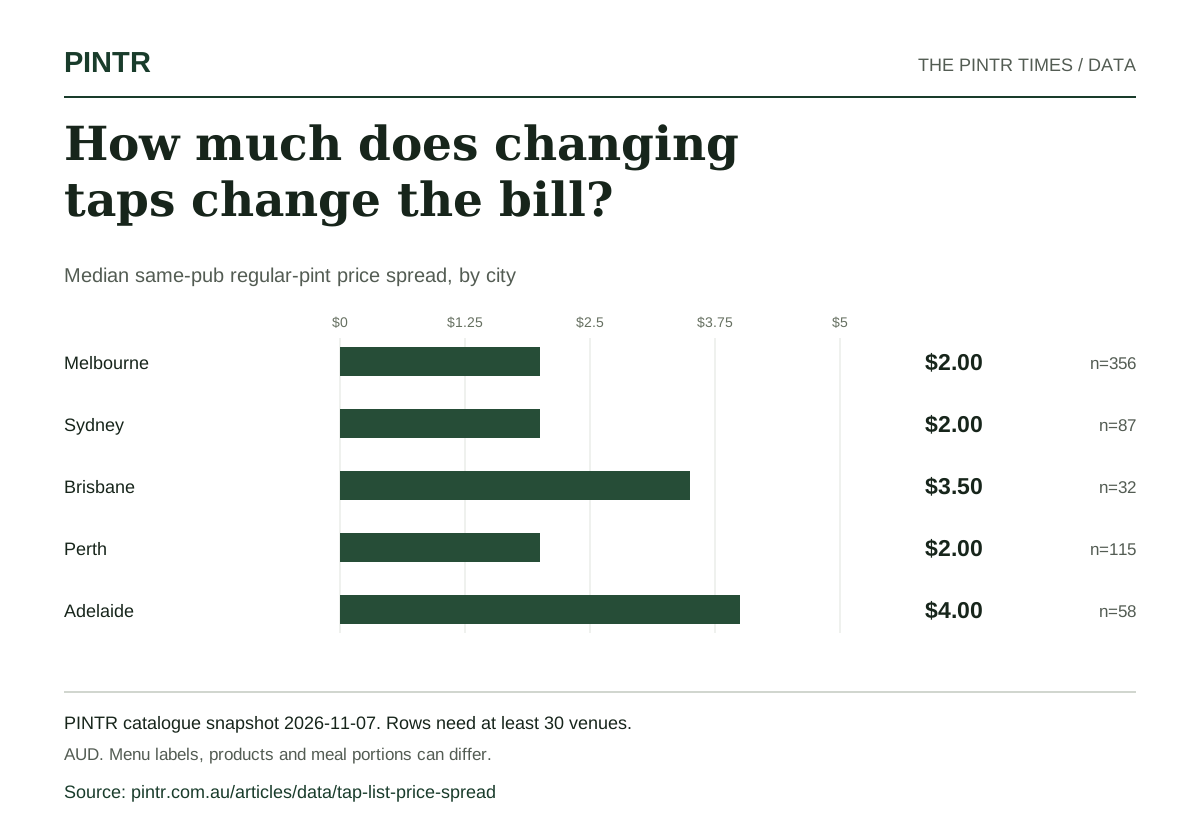
Median same-pub regular-pint price spread, by city
Regular prices · AUD · n = contributing venues
- Melbourne$2.00356 venues
- Sydney$2.0087 venues
- Brisbane$3.5032 venues
- Perth$2.00115 venues
- Adelaide$4.0058 venues
Rows with fewer than 30 venues are omitted. Menu-labelled pints; serving volumes and the beer mix can differ between places.
Download this chart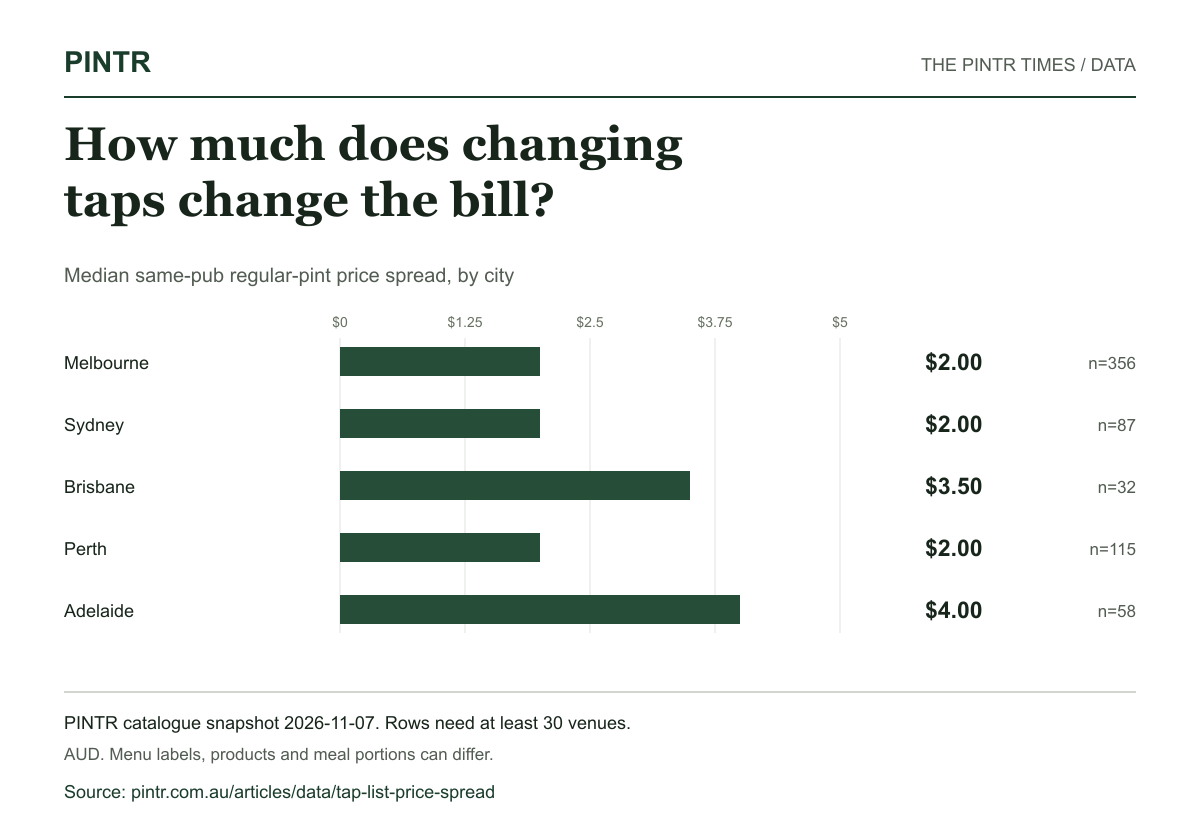
The next tap can matter as much as the next pub
A long tap list can put an everyday lager beside a stronger or dearer beer. This measures the price spread on that list; it does not pretend those beers are equivalent.
Two named beers are the minimum
A venue with only one identified pint price cannot show a tap-list spread. Generic “tap beer” offers and happy-hour prices stay out, so a timed deal cannot create an artificial gap.
How much does changing taps change the bill?
| Place | Venues | Median | Mean |
|---|---|---|---|
| Australia | 913 | $2.00 | $2.28 |
| Victoria | 433 | $2.00 | $2.31 |
| New South Wales | 157 | $1.90 | $1.91 |
| Queensland | 82 | $3.20 | $3.13 |
| Western Australia | 145 | $2.00 | $1.67 |
| South Australia | 64 | $4.00 | $3.71 |
| Melbourne | 356 | $2.00 | $2.37 |
| Sydney | 87 | $2.00 | $2.00 |
| Brisbane | 32 | $3.50 | $3.59 |
| Perth | 115 | $2.00 | $1.66 |
| Adelaide | 58 | $4.00 | $3.81 |
The data behind the report
Summary tables, contributing venue figures and a chart you can use. No sign-in or email required.
Frozen edition 2026-11-07-501081af9ed8. These download URLs remain attached to this snapshot.
What the fields mean
- venues / n
- Distinct contributing venues in that place and table; not all pubs in the area.
- value
- Highest minus lowest identified regular-pint price at the same venue, in AUD. regularPrice is the minimum and offerPrice is the maximum regular price, not a timed offer.
- checked
- Recorded source-check date. Blank means a complete date is unavailable. For a venue average or bill, every part needs a date; the earliest date is retained.
- snapshot_date
- When the public PINTR catalogue snapshot was retrieved, not when every venue’s menu was checked.
How we counted
913 distinct venues contribute 913 venue-level figures to this report. 416 of those figures have a complete recorded source-check date.
- PINTR includes pubs, bars, clubs and other licensed venues. Every headline count refers to the matching PINTR sample, not every pub in an area.
- A beer price must match a visible venue in the retrieved full catalogue. Unmatched venue records are excluded.
- This is a snapshot of reported prices in PINTR, not a representative survey of every Australian pub. A venue without a matching price is outside the denominator, rather than counted as expensive.
- Regular prices only. Happy hours, daily specials, members’ prices, alcohol-free products and drinks without an explicit serving label are excluded. Known venue aliases are counted once.
- A table row needs at least 30 contributing venues. City areas use PINTR’s published state-boundary and radius definitions; neighbouring city catchments can overlap.
- A snapshot date records when PINTR’s public catalogue was retrieved. It does not mean each menu was checked that day. Individual source-check dates, including blanks, are retained in the downloads.
- Require at least two distinct identified regular-pint products at a venue. Subtract its lowest price from its highest price; calculate the median of those venue gaps. The range can compare different beer styles.
- Beer comparisons use identified products labelled “pint” on the recorded menu. Unspecified tap/house beer listings are excluded. The label does not guarantee the same volume everywhere, particularly in South Australia; these figures are not a like-for-like volume ranking.
Prices come from PINTR’s published venue and price catalogue, retrieved . The public directory and downloads show the supporting figures. This report does not measure inflation, national market share or changes over time.
PINTR price methodologyCite this finding
PINTR’s “How much does changing taps change the bill?” report found a median of $2.00 across 913 matching venues.
PINTR. “How much does changing taps change the bill?” The PINTR Times. Catalogue snapshot 7 November 2026. https://www.pintr.com.au/articles/data/tap-list-price-spread
View chart embed code
Using the figures and charts
You’re welcome to quote PINTR’s aggregate findings and reuse these charts in your reporting. Please credit PINTR and link to this report. Keep the snapshot date and sample description with the figure. Venue photography and third-party material are outside this permission.
Need a particular city or a calculation checked? Contact the PINTR data desk.