
What does a pub feed cost?
The parma is $30.00 at the middle venue in our regular-menu sample. Steak and chips tell their own stories, so we’ve kept the three meals apart and put the state and city figures side by side.
median parma / parmi starting price · 3,211 venues
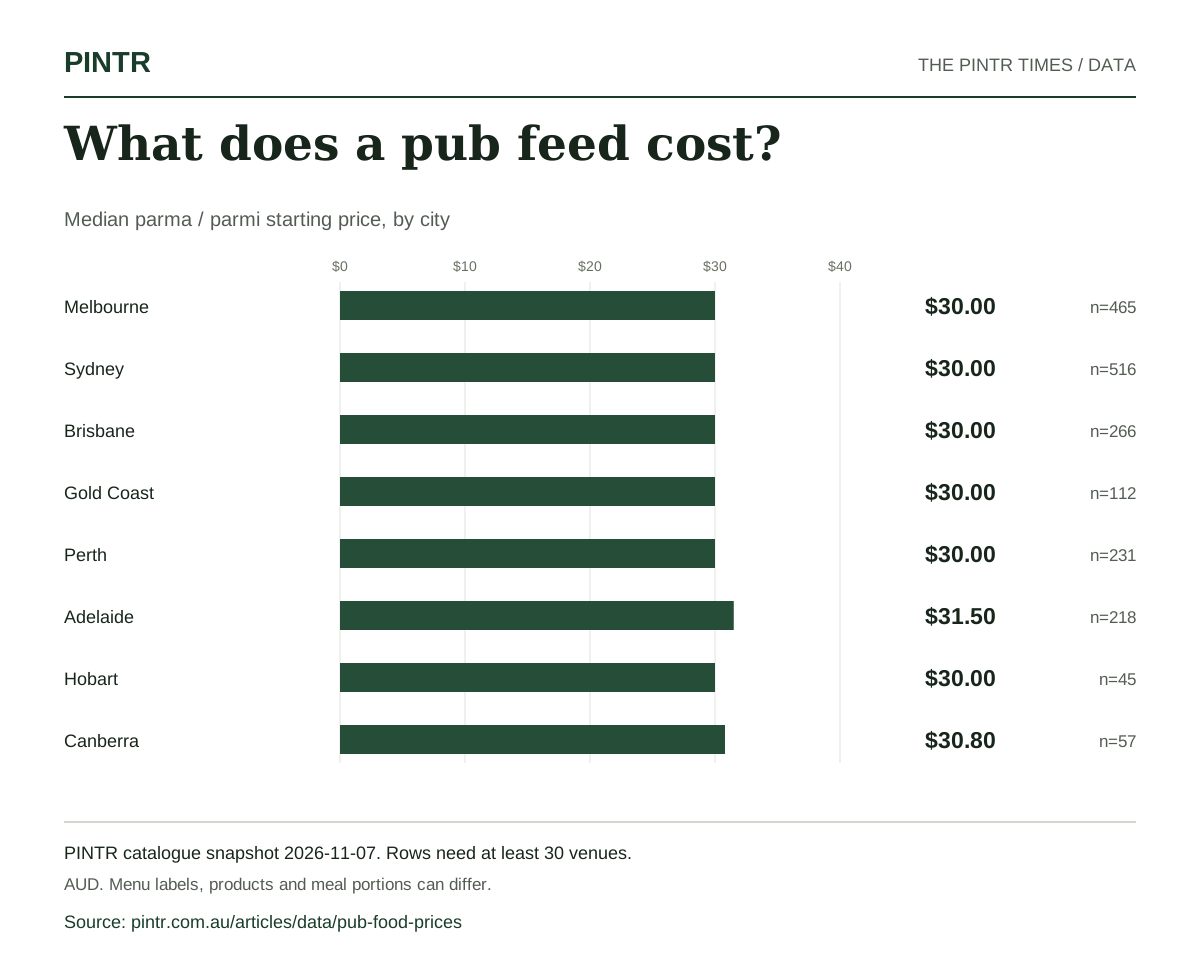
Median parma / parmi starting price, by city
Regular prices · AUD · n = contributing venues
- Melbourne$30.00465 venues
- Sydney$30.00516 venues
- Brisbane$30.00266 venues
- Gold Coast$30.00112 venues
- Perth$30.00231 venues
- Adelaide$31.50218 venues
- Hobart$30.0045 venues
- Canberra$30.8057 venues
Rows with fewer than 30 venues are omitted. Regular menu starting prices; dish portions and ingredients can differ.
Download this chart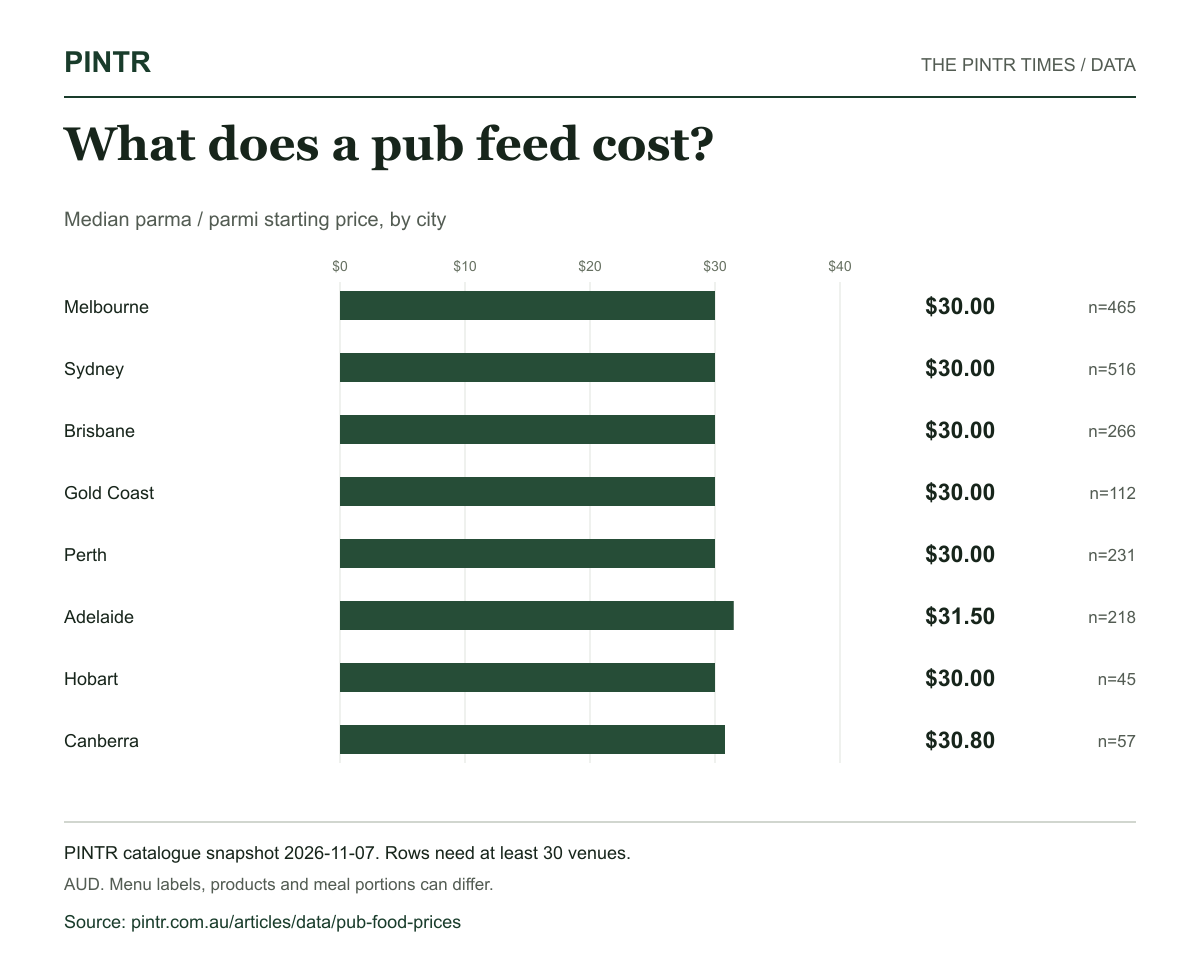
Start with the dish you actually want
Across the Australian samples, the median regular starting prices are $30.00 for chicken parma / parmi, $39.00 for steak and $11.00 for hot chips. Each category counts the cheapest matching regular dish once per venue. Daily specials stay out.
The menu still matters
A steak’s cut and weight, a parma’s sides and a bowl of chips’ portion can differ. These are useful menu starting points, rather than equal-sized meals. The venue-level download keeps the original dish name so a writer can narrow the comparison further.
Chicken parma / parmi
| Place | Venues | Median starting price | Mean starting price |
|---|---|---|---|
| Australia | 3,211 | $30.00 | $30.10 |
| Victoria | 730 | $30.00 | $29.87 |
| New South Wales | 1,042 | $30.00 | $29.76 |
| Queensland | 658 | $30.00 | $29.91 |
| Western Australia | 336 | $31.00 | $31.03 |
| South Australia | 269 | $31.50 | $31.10 |
| Tasmania | 86 | $31.00 | $31.08 |
| ACT | 57 | $30.80 | $30.30 |
| Northern Territory | 33 | $30.00 | $29.56 |
| Melbourne | 465 | $30.00 | $29.83 |
| Sydney | 516 | $30.00 | $29.54 |
| Brisbane | 266 | $30.00 | $29.59 |
| Gold Coast | 112 | $30.00 | $29.55 |
| Perth | 231 | $30.00 | $30.55 |
| Adelaide | 218 | $31.50 | $31.11 |
| Hobart | 45 | $30.00 | $30.55 |
| Canberra | 57 | $30.80 | $30.30 |
Steak
| Place | Venues | Median starting price | Mean starting price |
|---|---|---|---|
| Australia | 3,794 | $39.00 | $40.19 |
| Victoria | 846 | $44.00 | $44.22 |
| New South Wales | 1,234 | $36.00 | $37.36 |
| Queensland | 791 | $35.95 | $37.22 |
| Western Australia | 409 | $44.00 | $44.61 |
| South Australia | 310 | $40.00 | $41.43 |
| Tasmania | 96 | $42.50 | $43.72 |
| ACT | 72 | $39.00 | $39.34 |
| Northern Territory | 36 | $38.00 | $39.42 |
| Melbourne | 555 | $44.00 | $44.28 |
| Sydney | 625 | $36.00 | $37.44 |
| Brisbane | 321 | $36.00 | $37.40 |
| Gold Coast | 133 | $34.00 | $35.88 |
| Perth | 289 | $44.00 | $44.37 |
| Adelaide | 253 | $40.00 | $41.70 |
| Hobart | 49 | $42.00 | $42.30 |
| Canberra | 72 | $39.00 | $39.34 |
Hot chips
| Place | Venues | Median starting price | Mean starting price |
|---|---|---|---|
| Australia | 4,301 | $11.00 | $10.91 |
| Victoria | 1,022 | $12.00 | $11.34 |
| New South Wales | 1,335 | $10.00 | $10.52 |
| Queensland | 860 | $10.00 | $10.41 |
| Western Australia | 495 | $12.00 | $11.87 |
| South Australia | 341 | $12.00 | $11.17 |
| Tasmania | 123 | $10.00 | $10.30 |
| ACT | 86 | $12.00 | $11.38 |
| Northern Territory | 39 | $10.50 | $10.39 |
| Melbourne | 684 | $12.00 | $11.56 |
| Sydney | 690 | $11.00 | $10.95 |
| Brisbane | 360 | $11.00 | $10.55 |
| Gold Coast | 152 | $10.00 | $10.19 |
| Perth | 356 | $12.00 | $12.01 |
| Adelaide | 280 | $12.00 | $11.29 |
| Hobart | 69 | $10.00 | $10.34 |
| Canberra | 86 | $12.00 | $11.38 |
The data behind the report
Summary tables, contributing venue figures and a chart you can use. No sign-in or email required.
Frozen edition 2026-11-07-501081af9ed8. These download URLs remain attached to this snapshot.
What the fields mean
- venues / n
- Distinct contributing venues in that place and table; not all pubs in the area.
- value
- The venue price used in this report: lowest regular pint, venue-average pint, Guinness price, lowest matching dish or combined bill, as explained below.
- checked
- Recorded source-check date. Blank means a complete date is unavailable. For a venue average or bill, every part needs a date; the earliest date is retained.
- snapshot_date
- When the public PINTR catalogue snapshot was retrieved, not when every venue’s menu was checked.
How we counted
4,558 distinct venues contribute 11,306 venue-level figures to this report. 11,306 of those figures have a complete recorded source-check date.
- PINTR includes pubs, bars, clubs and other licensed venues. Every headline count refers to the matching PINTR sample, not every pub in an area.
- This is a snapshot of reported prices in PINTR, not a representative survey of every Australian pub. A venue without a matching price is outside the denominator, rather than counted as expensive.
- A table row needs at least 30 contributing venues. City areas use PINTR’s published state-boundary and radius definitions; neighbouring city catchments can overlap.
- A snapshot date records when PINTR’s public catalogue was retrieved. It does not mean each menu was checked that day. Individual source-check dates, including blanks, are retained in the downloads.
- Use regular food listings only; exclude daily specials. Match PINTR’s existing chicken parma / parmi, steak and hot-chip categories. Take the cheapest matching regular dish per venue and category, then calculate the median of those venue starting prices.
- Different steak cuts, meal weights, sides and portions are not standardised. This is a starting-price comparison, not a quality or portion-size comparison.
Prices come from PINTR’s published venue and price catalogue, retrieved . The public directory and downloads show the supporting figures. This report does not measure inflation, national market share or changes over time.
PINTR price methodologyCite this finding
The median regular chicken parma / parmi starting price was $30.00 across 3,211 venues in PINTR’s Australian sample. Where a pub listed several matching dishes, its lowest regular price was counted once.
PINTR. “What does a pub feed cost?” The PINTR Times. Catalogue snapshot 7 November 2026. https://www.pintr.com.au/articles/data/pub-food-prices
View chart embed code
Using the figures and charts
You’re welcome to quote PINTR’s aggregate findings and reuse these charts in your reporting. Please credit PINTR and link to this report. Keep the snapshot date and sample description with the figure. Venue photography and third-party material are outside this permission.
Need a particular city or a calculation checked? Contact the PINTR data desk.